Using Parseable with Datasette for OpenTelemetry traces
Parseable is a brand new observability tool, compatible with OpenTelemetry, for storing and querying observability data.
Datasette 1.0a41 added support for OpenTelemetry tracing, contributed by Alex Garcia.
Here's how I ran the two together, giving me neat local visualizations of traces of Datasette responses.
I used the open source release of Parseable from their GitHub releases - I tried v3.2.4. They have a macOS Apple Silicon release (a 171MB download) which I downloaded and ran like so:
curl -fL https://github.com/parseablehq/parseable/releases/download/v3.2.4/Parseable_OSS_aarch64-apple-darwin -o parseable
chmod +x parseable
./parseable local-store
Running ./parseable local-store starts Parseable with all of the default settings, and stores data in ./data and ./staging directories. It uses ports 8000, 8001, and 8002.
Then visit http://localhost:8000/ and sign in with the default admin/admin username and password.
I fetched a test database for Datasette to use:
wget https://latest.datasette.io/fixtures.dbThen I started Datasette like this:
OTEL_SERVICE_NAME=datasette-local \
OTEL_EXPORTER_OTLP_ENDPOINT=http://127.0.0.1:8000 \
OTEL_EXPORTER_OTLP_TRACES_HEADERS='Authorization=Basic%20YWRtaW46YWRtaW4%3D,X-P-Stream=datasette_traces' \
OTEL_TRACES_EXPORTER=otlp_json_http \
OTEL_METRICS_EXPORTER=none \
OTEL_LOGS_EXPORTER=none \
uvx --from 'opentelemetry-instrumentation==0.66b1' \
  --with 'opentelemetry-distro==0.66b1' \
  --with 'datasette==1.0a41' \
  --with 'opentelemetry-exporter-otlp-json-http==0.66b1' \
  opentelemetry-instrument datasette fixtures.db -p 8004
Note that we are not starting datasette directly - we are instead starting opentelemetry-instrument datasette ... to properly initialize the tracing.
Load up http://localhost:8004/ and click around a bit, then wait a few seconds for the traces to be sent to Parseable. Then navigate to "traces" in the Parseable web interface and you should be able to find things like this:
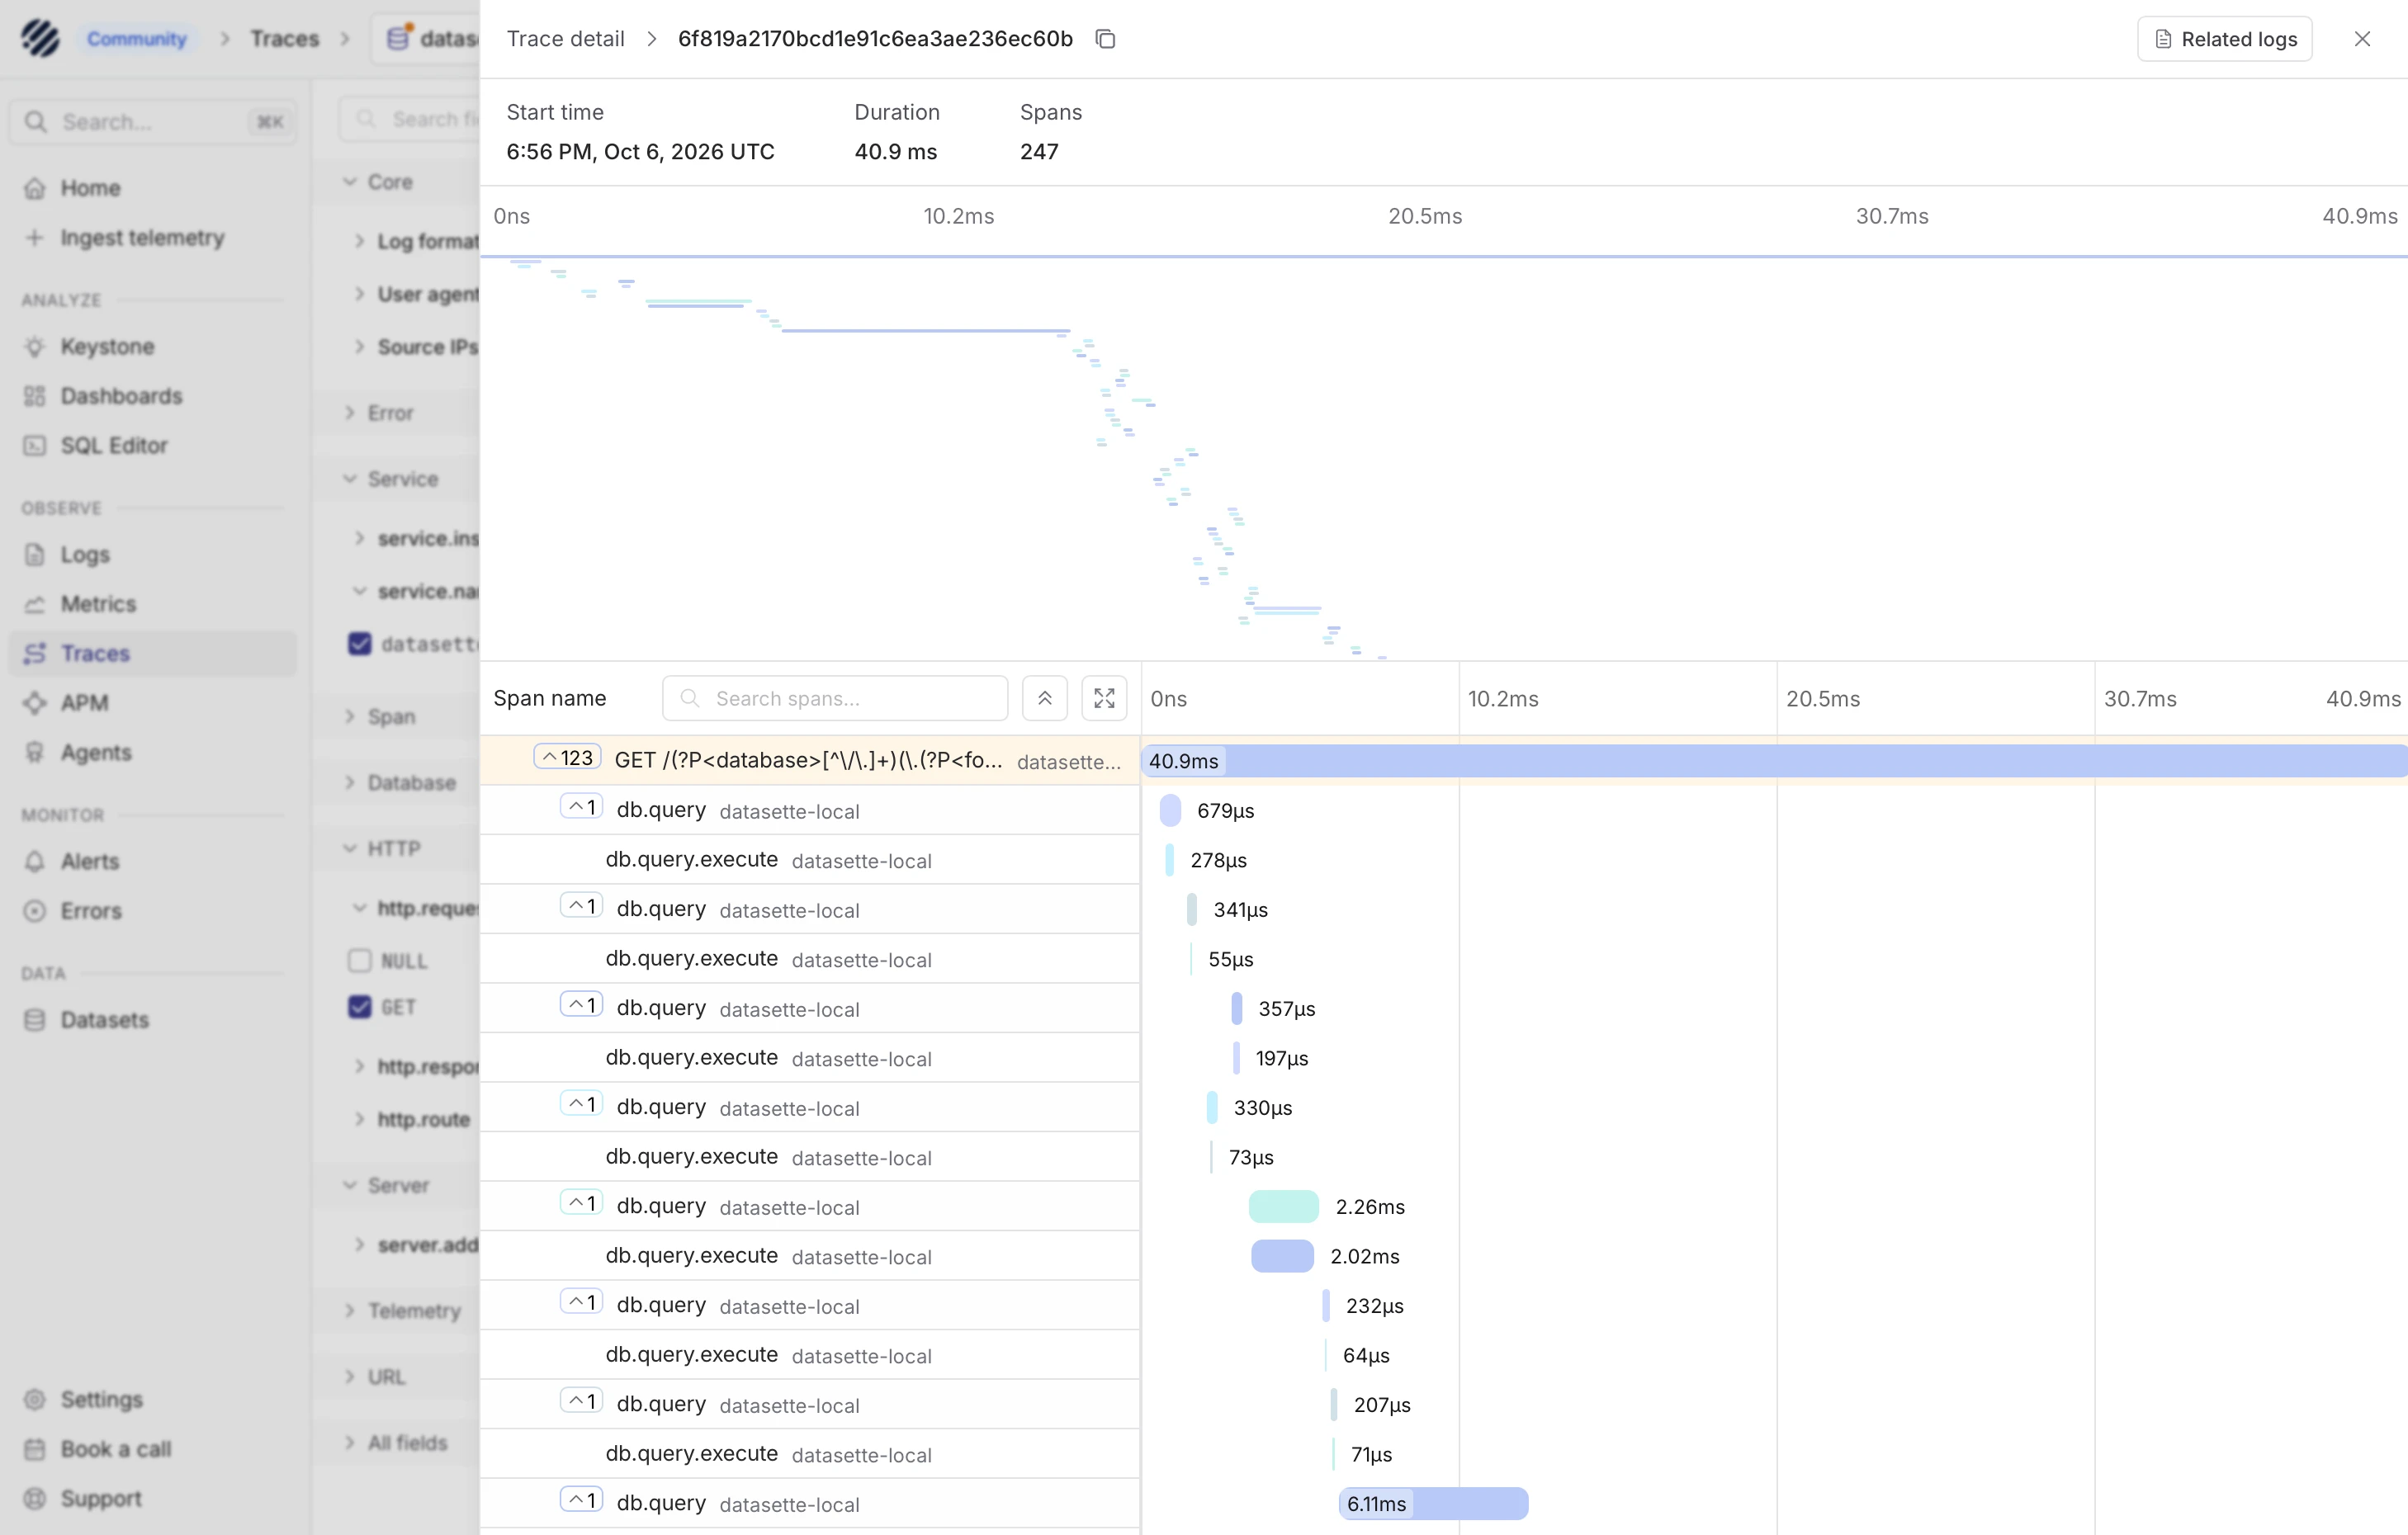
Each request now has a trace which shows the details of every subsequent SQL query. Consult the Datasette OpenTelemetry docs for more details.
To run Parseable on ports other than 8000, 8001, and 8002:
P_ADDR=127.0.0.1:18000 ./parseable local-store \
  --grpc-port 18001 \
  --flight-port 18002
You'll need to also update Datasette's environment variable to point at the new port:
OTEL_EXPORTER_OTLP_ENDPOINT=http://127.0.0.1:18000Created 2026-10-06T12:07:31-07:00 · Edit