Histogram with tooltips in Observable Plot
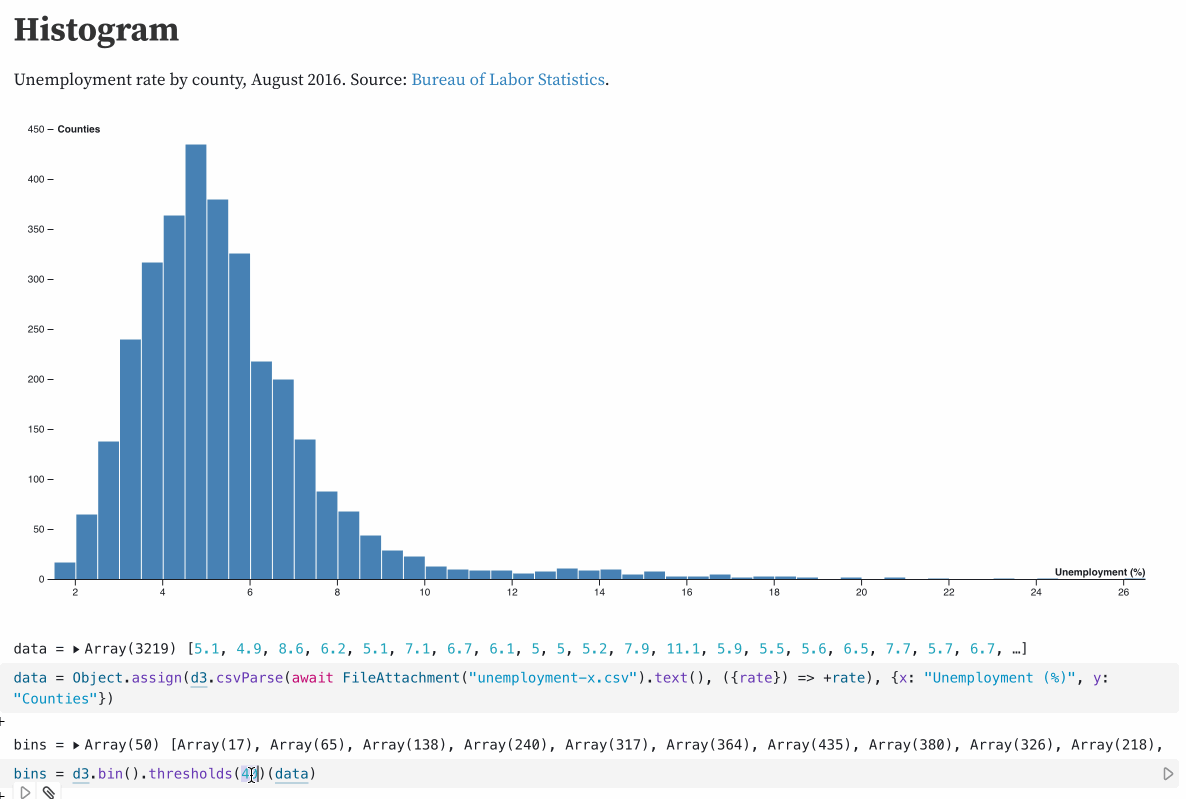
Given an array of datetime objects, I wanted to plot a histogram. But I wanted to automatically pick a bucket size for that histogram that resulted in something interesting, no matter what range of time the individual points covered.
I figured out that d3 has a mechanism for this: d3.bin().thresholds() (docs here). This defaults to using Sturges' formula but has various other options.
This d3 Histogram notebook helped me figure this out:
Implementing this in Observable Plot
The higher level Observable Plot library provides binning. Here's the recipe I figured out for generating a histogram with that, in my Histogram of my tweets over time notebook:
Plot.plot({
  y: {
    grid: true
  },
  marks: [Plot.rectY(tweets, Plot.binX({ y: "count" }, { x: "created_at" }))]
})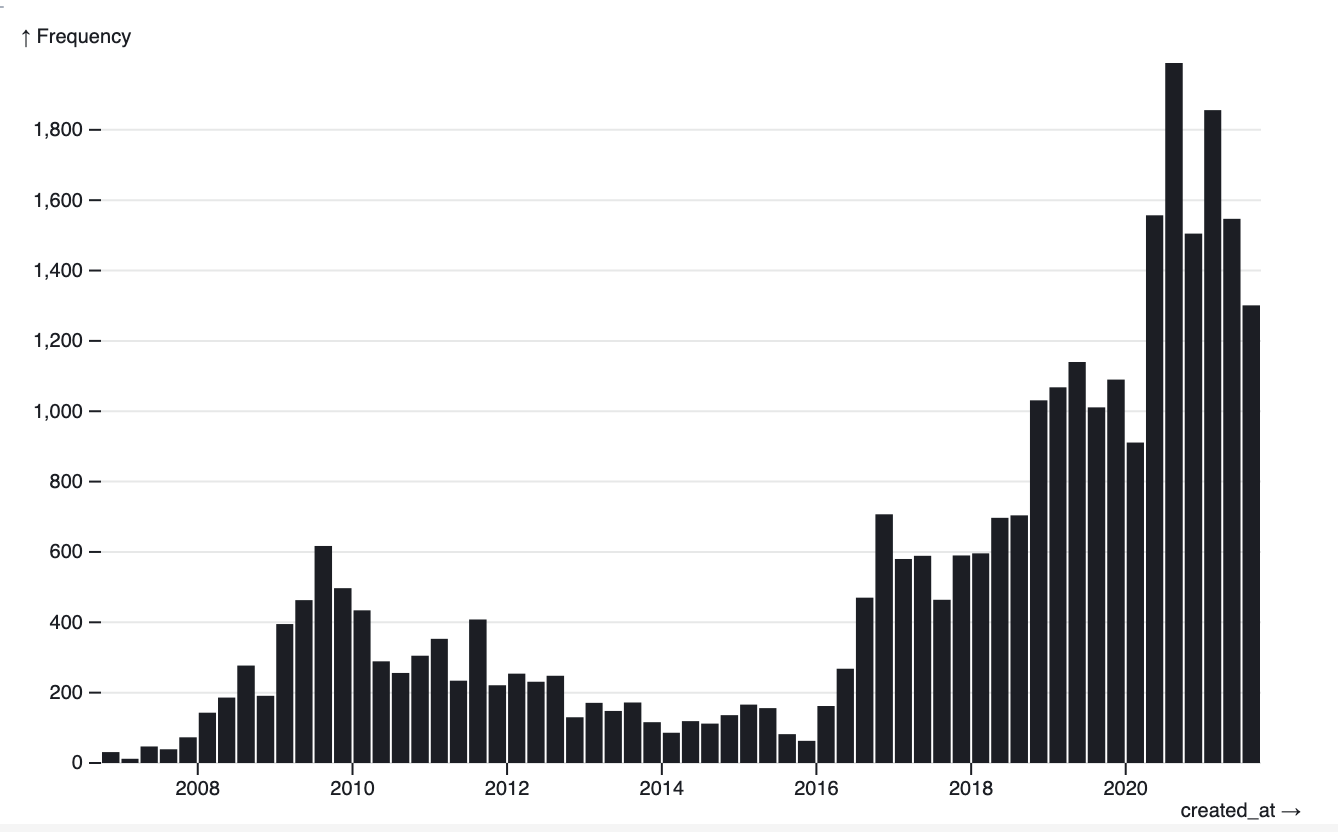
It turns out that while d3 uses Sturges' formula Observable Plot instead uses Scott's rule:
D3 chose Sturges’ formula because it was the popular choice (at the time) but Observable Plot defaults to Scott’s rule, with a max of 200 bins, which tends to perform better. Related: https://robjhyndman.com/papers/sturges.pdf
Mike Bostock - @mbostock
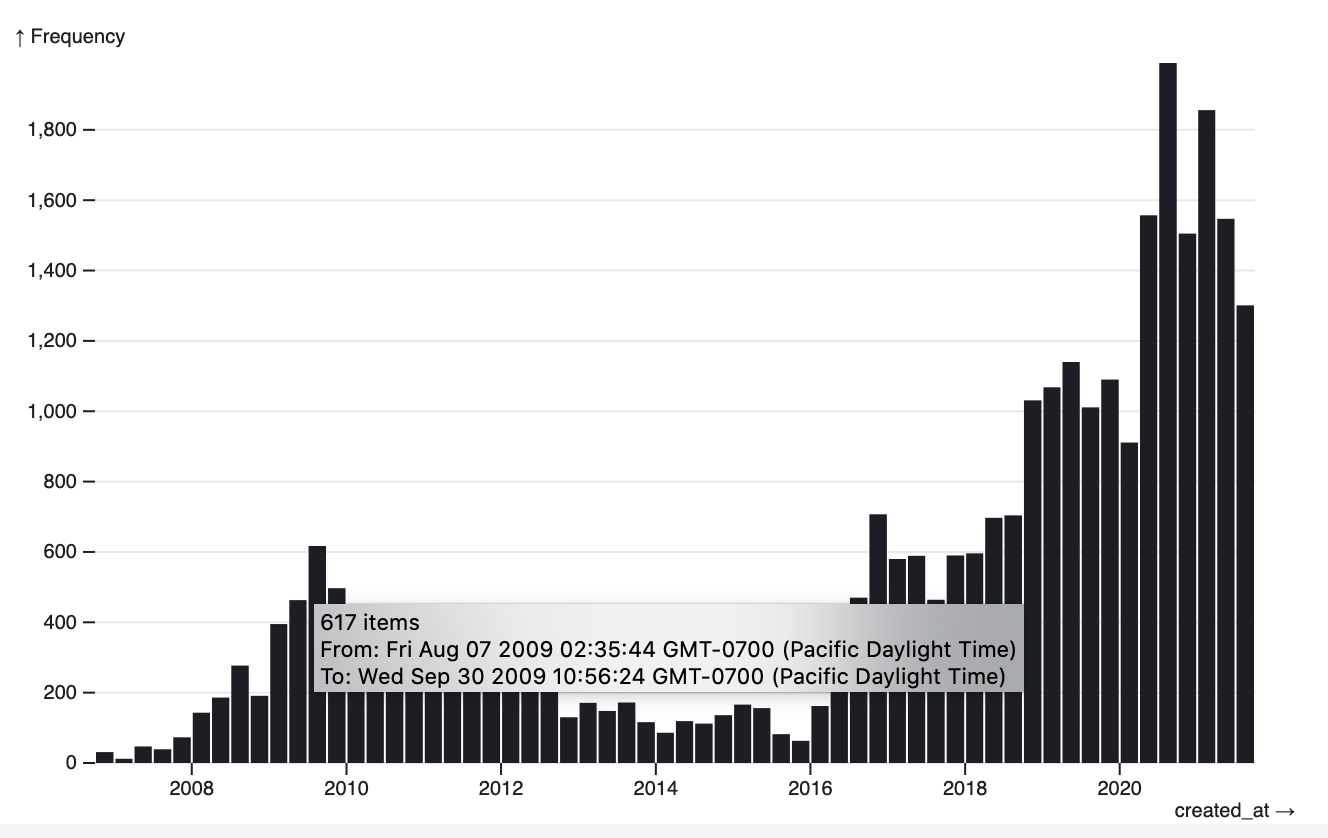
Adding tooltips
I wanted to add tooltips to the above chart. This was the hardest part to figure out - it turns out that second argument to .binX() can take a title option, which can be a function that accepts a bin array of items and returns a title.
UPDATE 27th January 2022: The below code example no longer works - the bin argument passed to the title: function used to be a list of items in that bin, but now appears to just be a single item.
This is what I ended up using:
Plot.plot({
  y: {
    grid: true
  },
  marks: [
    Plot.rectY(
      tweets,
      Plot.binX(
        { y: "count" },
        {
          x: "created_at",
          title: bin => {
            let sorted = [...Array.from(bin).map(t => t.created_at)].sort();
            let min = sorted[0];
            let max = sorted.slice(-1)[0];
            let count = sorted.length;
            return `${sorted.length} item${
              sorted.length == 0 ? '' : 's'
            }\nFrom: ${min}\nTo: ${max}`;
          }
        }
      )
    )
  ]
})-
[...bin.map(t => t.created_at)].sort()is a recipe for creating a sorted copy of an array of values -
max = sorted.slice(-1)[0]gets the last item in that array
Then I compose and return the string.
Here's my Twitter thread where I figured this out.
Related
Created 2021-08-21T15:47:27-07:00, updated 2022-01-27T14:40:31-08:00 · History · Edit