Reading thermometer temperatures over time from a video
Natalie has been experimenting with using a microwave as a kiln for pottery, specifically for Raku.
She wanted to understand how long to run the microwave to reach the desired temperature for the Raku glazes to work.
But... her thermometer can't go in the microwave while it's running. So she needs to remove the kiln component from the microwave, attach it to the thermometer and measure how it cools over time in order to calculate its peak temperature while the microwave is running.
The tedious way to do this would be to watch the thermometer for over an hour as it cools down, making notes on the temperature at different points and then plotting those on a graph to derive that original temperature.
Or... how about recording a video of the thermometer and extracting the readings via OCR instead?
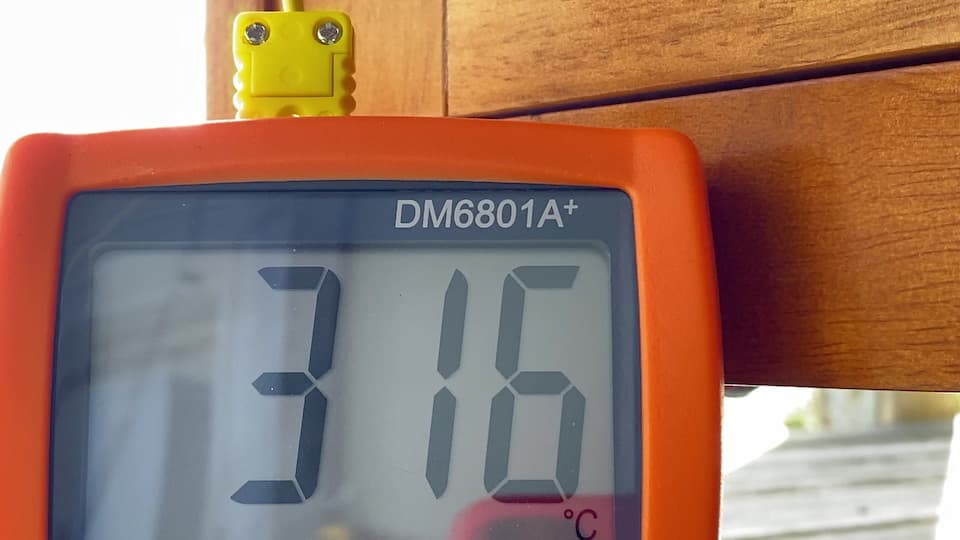
We rigged up an iPhone on a stand, pointed it at the digital LCD on the thermometer, and left it running for nearly two hours.
Splitting a video into frames every 10s
GPT-4 prompt:
Write a zsh script to run on macOS with ffmpeg available that takes a path to a video file and then spits out a single frame from every 10s of video in a file with a filename that reflects the time within the video
It gave me back this:
#!/bin/zsh

# Check if input file is provided
if [ "$#" -ne 1 ]; then
  echo "Usage: $0 <input_video_file>"
  exit 1
fi

# Check if ffmpeg is installed
if ! command -v ffmpeg >/dev/null 2>&1; then
  echo "ffmpeg is required but not installed. Please install ffmpeg first."
  exit 1
fi

INPUT_VIDEO="$1"
OUTPUT_DIR="frames"

# Create the output directory if it does not exist
mkdir -p "$OUTPUT_DIR"

# Get the duration of the video in seconds
DURATION=$(ffprobe -v error -show_entries format=duration -of default=noprint_wrappers=1:nokey=1 "$INPUT_VIDEO")
DURATION=$(printf "%.0f" "$DURATION")

# Extract a frame every 10 seconds
for ((i=0; i<=DURATION; i+=10)); do
  OUTPUT_FILENAME=$(printf "${OUTPUT_DIR}/frame_%02d:%02d:%02d.jpg" $((i/3600)) $(((i/60)%60)) $((i%60)))
  ffmpeg -ss "$i" -i "$INPUT_VIDEO" -vf "select=eq(pict_type\,PICT_TYPE_I)" -vframes 1 -q:v 2 "$OUTPUT_FILENAME" -y
done

echo "Frames extracted successfully in the ${OUTPUT_DIR} directory."
Executed like this:
./extract_frames.sh IMG_9684.MOV
This ran perfectly, without any modifications. It generated a folder full of JPG images, taken from 10s intervals of the raw video.
Each image looked like this:
Running OCR
This next step proved harder than I expected.
My first attempt used textra by Dylan Freedman. This is a fantastic little CLI tool which runs on macOS and uses the powerful VisionKit APIs on that platform to run OCR and audio extraction.
% textra frame_01:00:00.jpg -s
DM6801A+
Just one problem: it picked up the text at the top of the image, but it didn't get the output of the LCD display itself with the temperature.
Next I tried my own s3-ocr tool, which uses AWS Textract. I've had amazing results with this in the past, but while it did better it still wasn't nearly reliable enough at extracting the numeric readouts from this particular series of images.
I hadn't tried it myself, but I'd heard good things about Google Cloud Vision - so I gave that a go using their online demo:
That's exactly what I need!
Next challenge: how to automate it?
Using the Cloud Vision API
GPT-4 prompt:
I want to use the google cloud vision API to run OCR from a python script
First help me understand what access token credentials I need for this project and how to create them
Full transcript here. Asking it about access token credentials was a bit of a stretch: I hate figuring out how to make these, but I was pretty confident that any steps it gave me here would have been out-dated by changes Google had made to their console interface since the training cut-off date for GPT-4 of September 2021.
My skepticism was misplaced! It gave me step by step instructions which mostly worked - and gave me enough information to figure out how to get hold of a JSON file representing credentials for a service account that could call the Cloud Vision API.
The code it gave me was useful too. I fired up a Jupyter notebook and evolved it until it looked like this:
import os

from google.cloud import vision
from google.oauth2 import service_account

def ocr_image(image_path, credentials_path):
    credentials = service_account.Credentials.from_service_account_file(credentials_path)
    client = vision.ImageAnnotatorClient(credentials=credentials)
    with open(image_path, 'rb') as image_file:
        content = image_file.read()
    image = vision.Image(content=content)
    response = client.text_detection(image=image)
    texts = response.text_annotations
    return texts[0].description if texts else ''

image_path = "ocr-video-frames/frames-9679/frame_00:00:30.jpg"
credentials_path = "cloud-vision-ocr-382418-fee63d63124b.json"
result = ocr_image(image_path, credentials_path)
print(result)
Then I wrote my own code to run it against every image in my directory:
import pathlib
import sqlite_utils

root = pathlib.Path("ocr-video-frames/")

db = sqlite_utils.Database("ocr.db")

for path in root.glob("*/*.jpg"):
    relative = str(path.relative_to(root))
    text = ocr_image(path, credentials_path)
    db["results"].insert({
        "key": relative,
        "text": text
    }, pk="key")
This gave me a SQLite database file containing the extracted text from every one of my images.
Extracting the temperatures in Datasette with a regular expression
The OCR extracted text data wasn't just the temperatures I needed. For some of the frames it looked more like this:
DM6801A+
180
POWER
HOLD
0.1°
F
°F
TI
THERMOMETER
TYPE-K
1.0°
°C
The bit I care about is the "180" - three decimal characters with a newline before and after them.
I installed the new datasette-sqlite-regex plugin by Alex Garcia:
datasette install datasette-sqlite-regex
Then I opened up my SQLite database in Datasette and constructed the following query:
select
  regex_find('[0-9]{2}:[0-9]{2}:[0-9]{2}', key) as time,
  trim(regex_find('\n[0-9]{3}\n', text), char(10)) as temperature
from
  results
where key like 'frames/%' and temperature is not null
order by
  [time]
The resulting table looked like this:
| time | temperature |
|---|---|
| 00:02:00 | 830 |
| 00:02:10 | 834 |
| 00:02:20 | 836 |
| 00:02:40 | 834 |
| 00:03:20 | 820 |
| 00:03:30 | 816 |
| 00:03:40 | 812 |
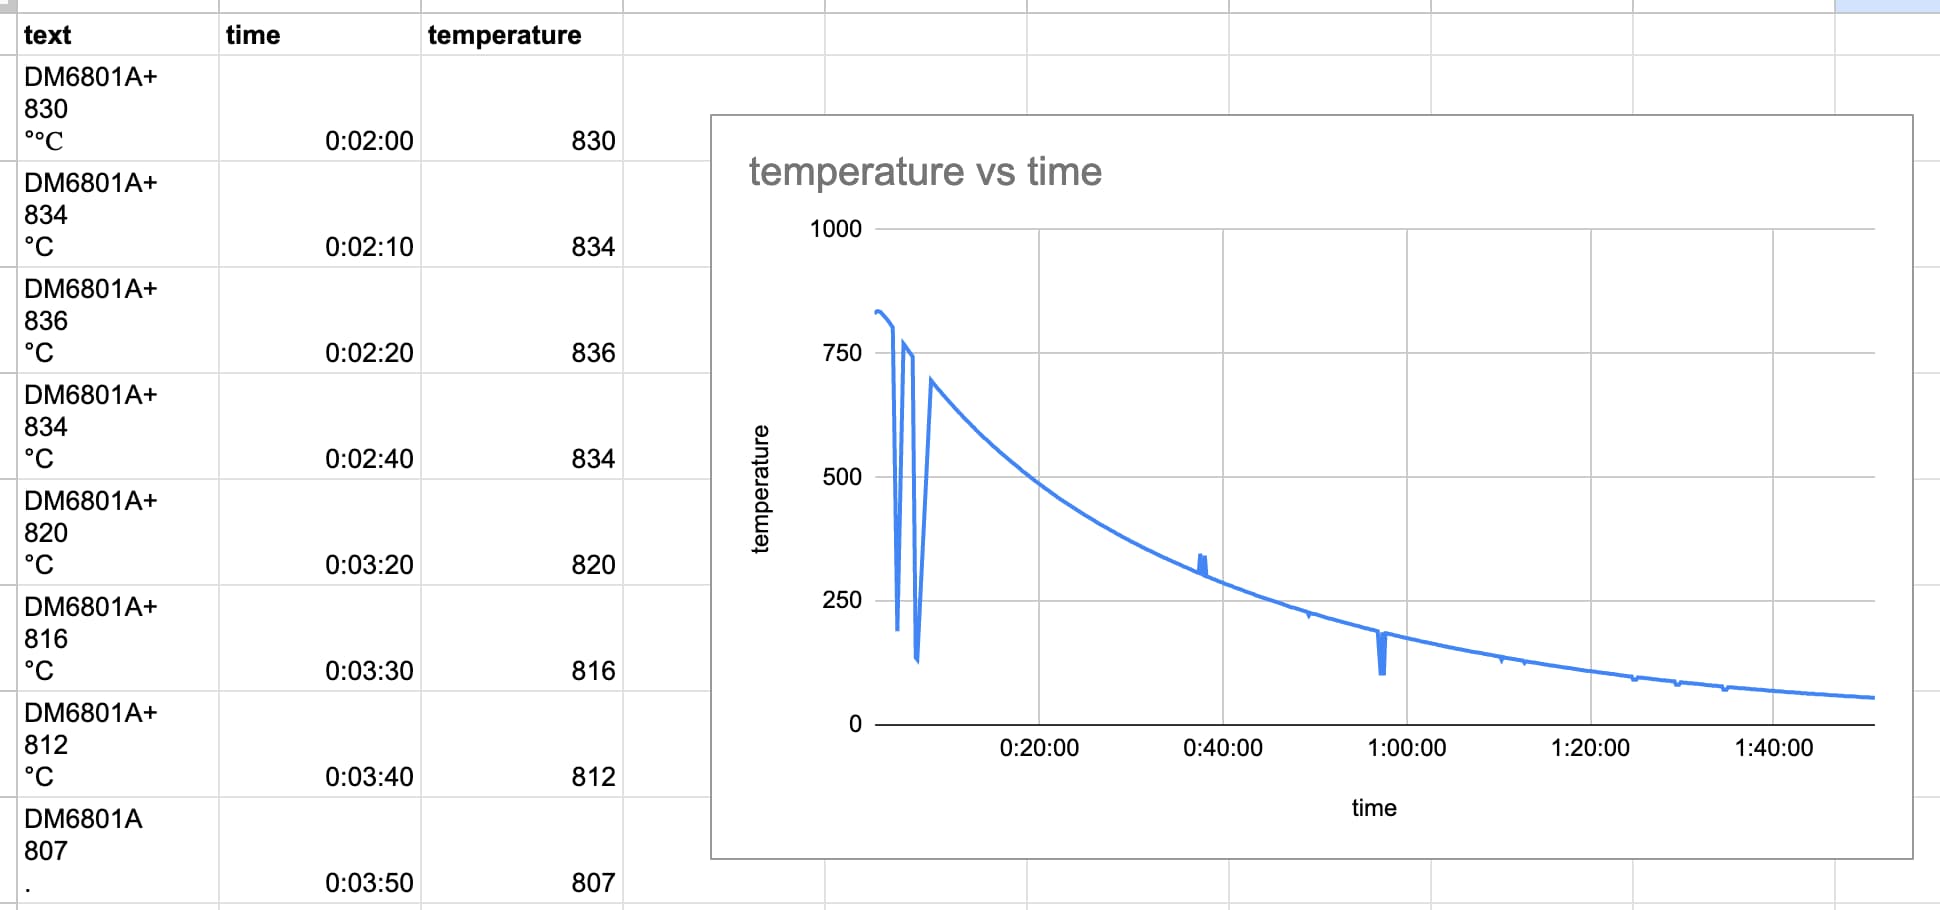
I used datasette-copyable to copy the data out to a Google Sheet. Here's my first attempt at charting the data, which makes it easy to spot places where the OCR got the wrong results:
Related
Created 2023-04-02T10:29:24-07:00, updated 2023-04-02T10:51:58-07:00 · History · Edit


